1/2


3D Spectrum Analyzer LWP
1K+Изтегляния
883kBРазмер
1.02(20-05-2020)Това е най-новата версия
ДетайлиПрегледиВерсииИнформация
1/2

Описание на 3D Spectrum Analyzer LWP
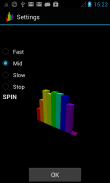
3D Spectrum Analyzer Live Wallpaper shows a frequency spectrum of the audio output using a 3D bar graph.
Each bar indicates signal strength of each octave band.
The red bar represents the lowest octave band and the purple bar represents the highest octave band.
If you don't know how to use it, please visit our website.
3D Spectrum Analyzer LWP - Version 1.02
(20-05-2020)Какво новоFixed several minor issues.
3D Spectrum Analyzer LWP - APK информация
APK версия: 1.02Пакет: com.yxssystems.wallpaper.threedspectrumanalyzerИме: 3D Spectrum Analyzer LWPРазмер: 883 kBИзтегляния: 11Версия : 1.02Дата на пускане: 2022-06-06 06:49:14Мин. екран: SMALLПоддържано CPU:
ID на пакет: com.yxssystems.wallpaper.threedspectrumanalyzerSHA1 подпис: D7:92:EA:53:5D:92:F0:03:EA:35:F8:37:5F:39:36:FA:C9:95:CB:CBРазработчик (CN): Организация (O): Местен (L): Държава (C): Област/град (ST): ID на пакет: com.yxssystems.wallpaper.threedspectrumanalyzerSHA1 подпис: D7:92:EA:53:5D:92:F0:03:EA:35:F8:37:5F:39:36:FA:C9:95:CB:CBРазработчик (CN): Организация (O): Местен (L): Държава (C): Област/град (ST):
Latest Version of 3D Spectrum Analyzer LWP
1.02
20/5/202011 изтегляния883 kB Размер
Други версии
1.0
1/4/201311 изтегляния17.5 kB Размер


